You know that handy diagram that’s made its way around Church publications for several decades now? I first encountered it in high school seminary, where it shows a cycle of righteousness and wickedness, pride and repentance. It was in a seminary video depicting Helaman 7–9. It’s also been the subject of, among other things, a recent BYU devotional and a coloring page (although I only see one illustration of pride there). Here’s the chart as found in this year’s Come Follow Me manual:
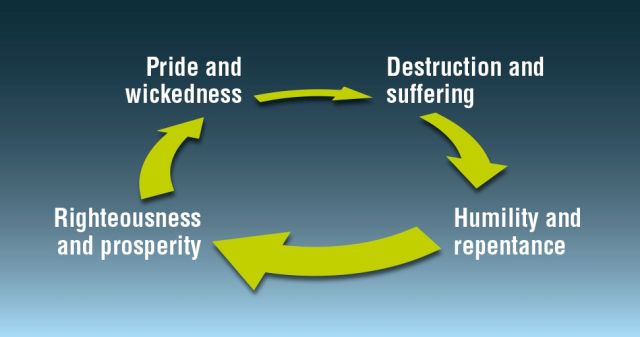
This diagram is actually not unique to Latter-day Saint publications. Among Protestant writers it’s sometimes called the Cycle of Sin, or the Judges Cycle (because it’s depicted so clearly and repeatedly in the book of Judges). Just do a Google image search and you’ll find many thoughtful versions from a variety of Christians, Latter-day Saint or non-. I’ve even looked for it in the Qur’an.
There are various ways to divide and label the steps in the cycle. I’ve seen versions that are five steps, six steps, a dozen steps. In my own version, I prefer to reduce it to the four simplest main steps, then to insert minor intermediate steps as needed for the particulars of the lesson at hand.
This is a good and true and useful chart. It very incisively describes real events that you and I act out almost daily. But when I first saw it it in high school, I thought, it’s also a tad fatalistic. Are we doomed to endlessly repeat it? The Savior wouldn’t have, and even if we never take it, there must surely exist another option. If we were to break the cycle, where would we do that?
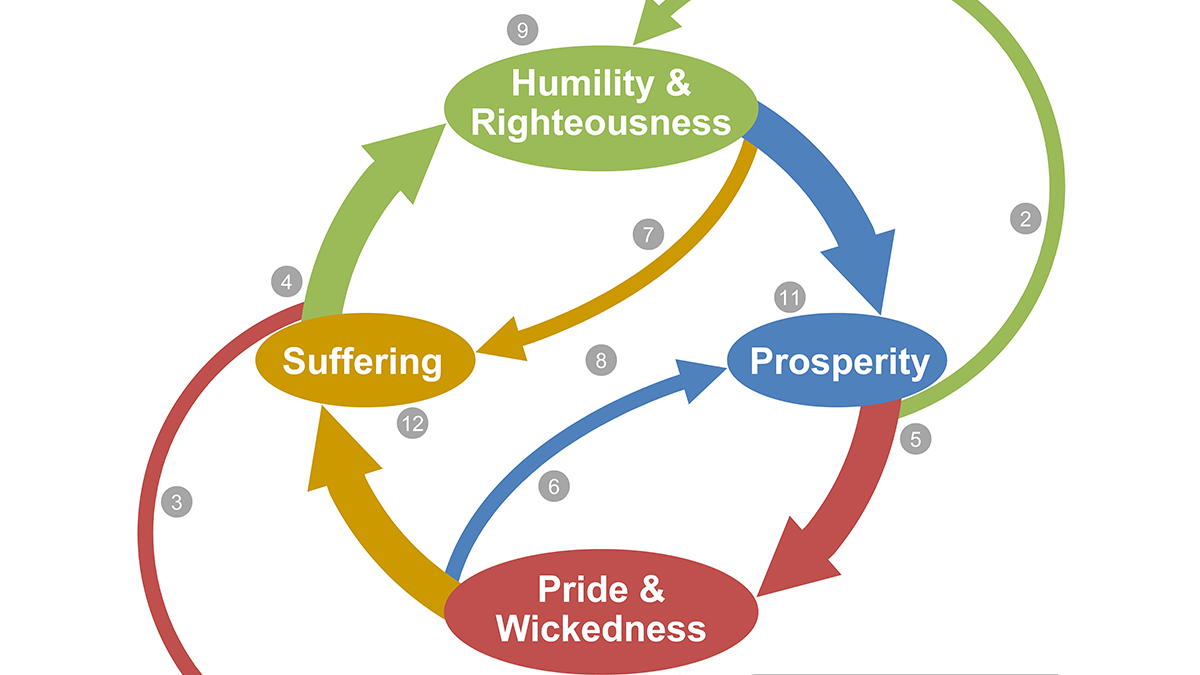
From that one question began a diagramming experiment that resulted in this chart a few years later. I ended up adding four new paths that depict alternate possibilities. To distinguish my expanded version from the original, as well as to add a touch of optimism, I call mine the Humility Cycle:
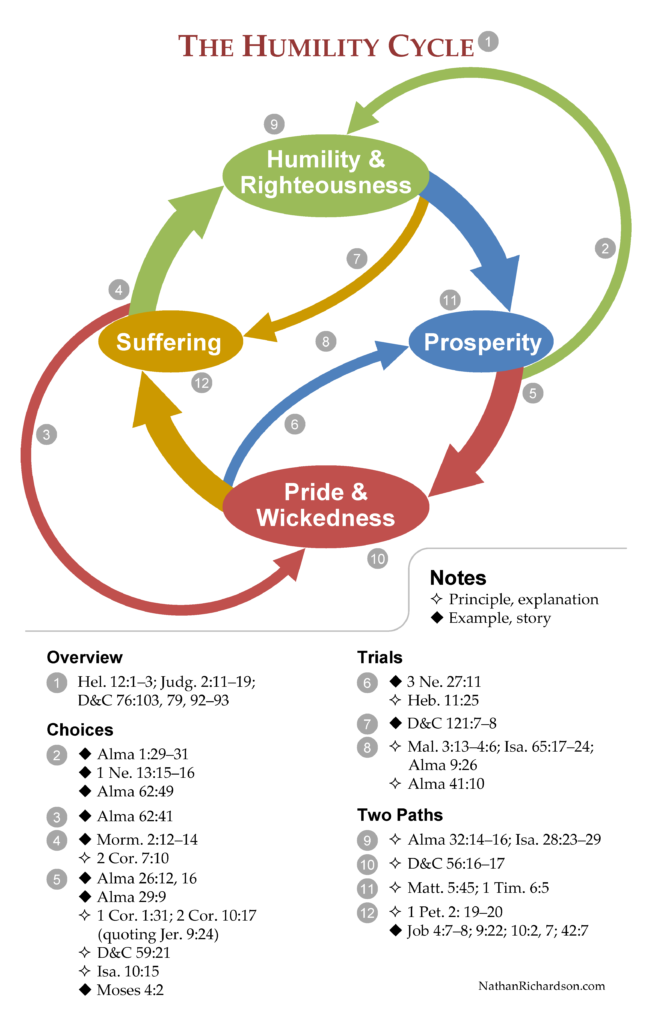
I actually have a two-hour long presentation that builds the diagram one piece at a time, going through all the examples and explanations in the verses listed on the handout. Some day I’d love to convert that presentation into an interactive video, where the user can click on which part of the chart they want to explore next (alas, I have no idea what software to use to do that). But for now, I think readers can get the main idea just from studying the handout closely.
Looks great, Nathan! Thank you for sharing your hard work with all of us. I hope to someday experience your presentation to go along with this. Keep up the great work 🙂
Thanks so much! Just perfect to close my lesson next week!
I would love to see your 2 hour presentation. Is it recorded somewhere?
I haven’t recorded it yet, although I keep meaning to. I’ve presented it at Education Week and by request in some wards as a Sunday school lesson or fireside. One of these days I’d love to get a quality recording of it.